Visualization without visualization specification file
In this example let us consider some visualisation possibilities of PEtab. In particluar, let us focus on the options that do not require detailed specifications. If you want to have more control over what will be plotted, refer to this example, describing usage of the visualization table.
Let’s plot measurements corresponding to the ones of the models from the Benchmark collection Fujita_SciSignal2010.
import petab
from petab.visualize import plot_data_and_simulation

folder = "example_Fujita/"
data_file_path = folder + "Fujita_measurementData.tsv"
condition_file_path = folder + "Fujita_experimentalCondition.tsv"
observables_file_path = folder + "Fujita_observables.tsv"
Plotting PEtab problem directly
For plotting a PEtab problem directly you can use the plot_problem() function.
# load PEtab problem from files
pp = petab.Problem.from_files(
    measurement_file=data_file_path,
    condition_file=condition_file_path,
    observable_files=observables_file_path,
)
# Alternatively, from yaml file
# pp = petab.Problem.from_yaml(folder + "Fujita.yaml")

# plot measurements
ax = petab.visualize.plot_problem(petab_problem=pp)
/tmp/ipykernel_793/1087859607.py:2: DeprecationWarning: petab.Problem.from_files is deprecated and will be removed in a future version. Use `petab.Problem.from_yaml instead.
  pp = petab.Problem.from_files(
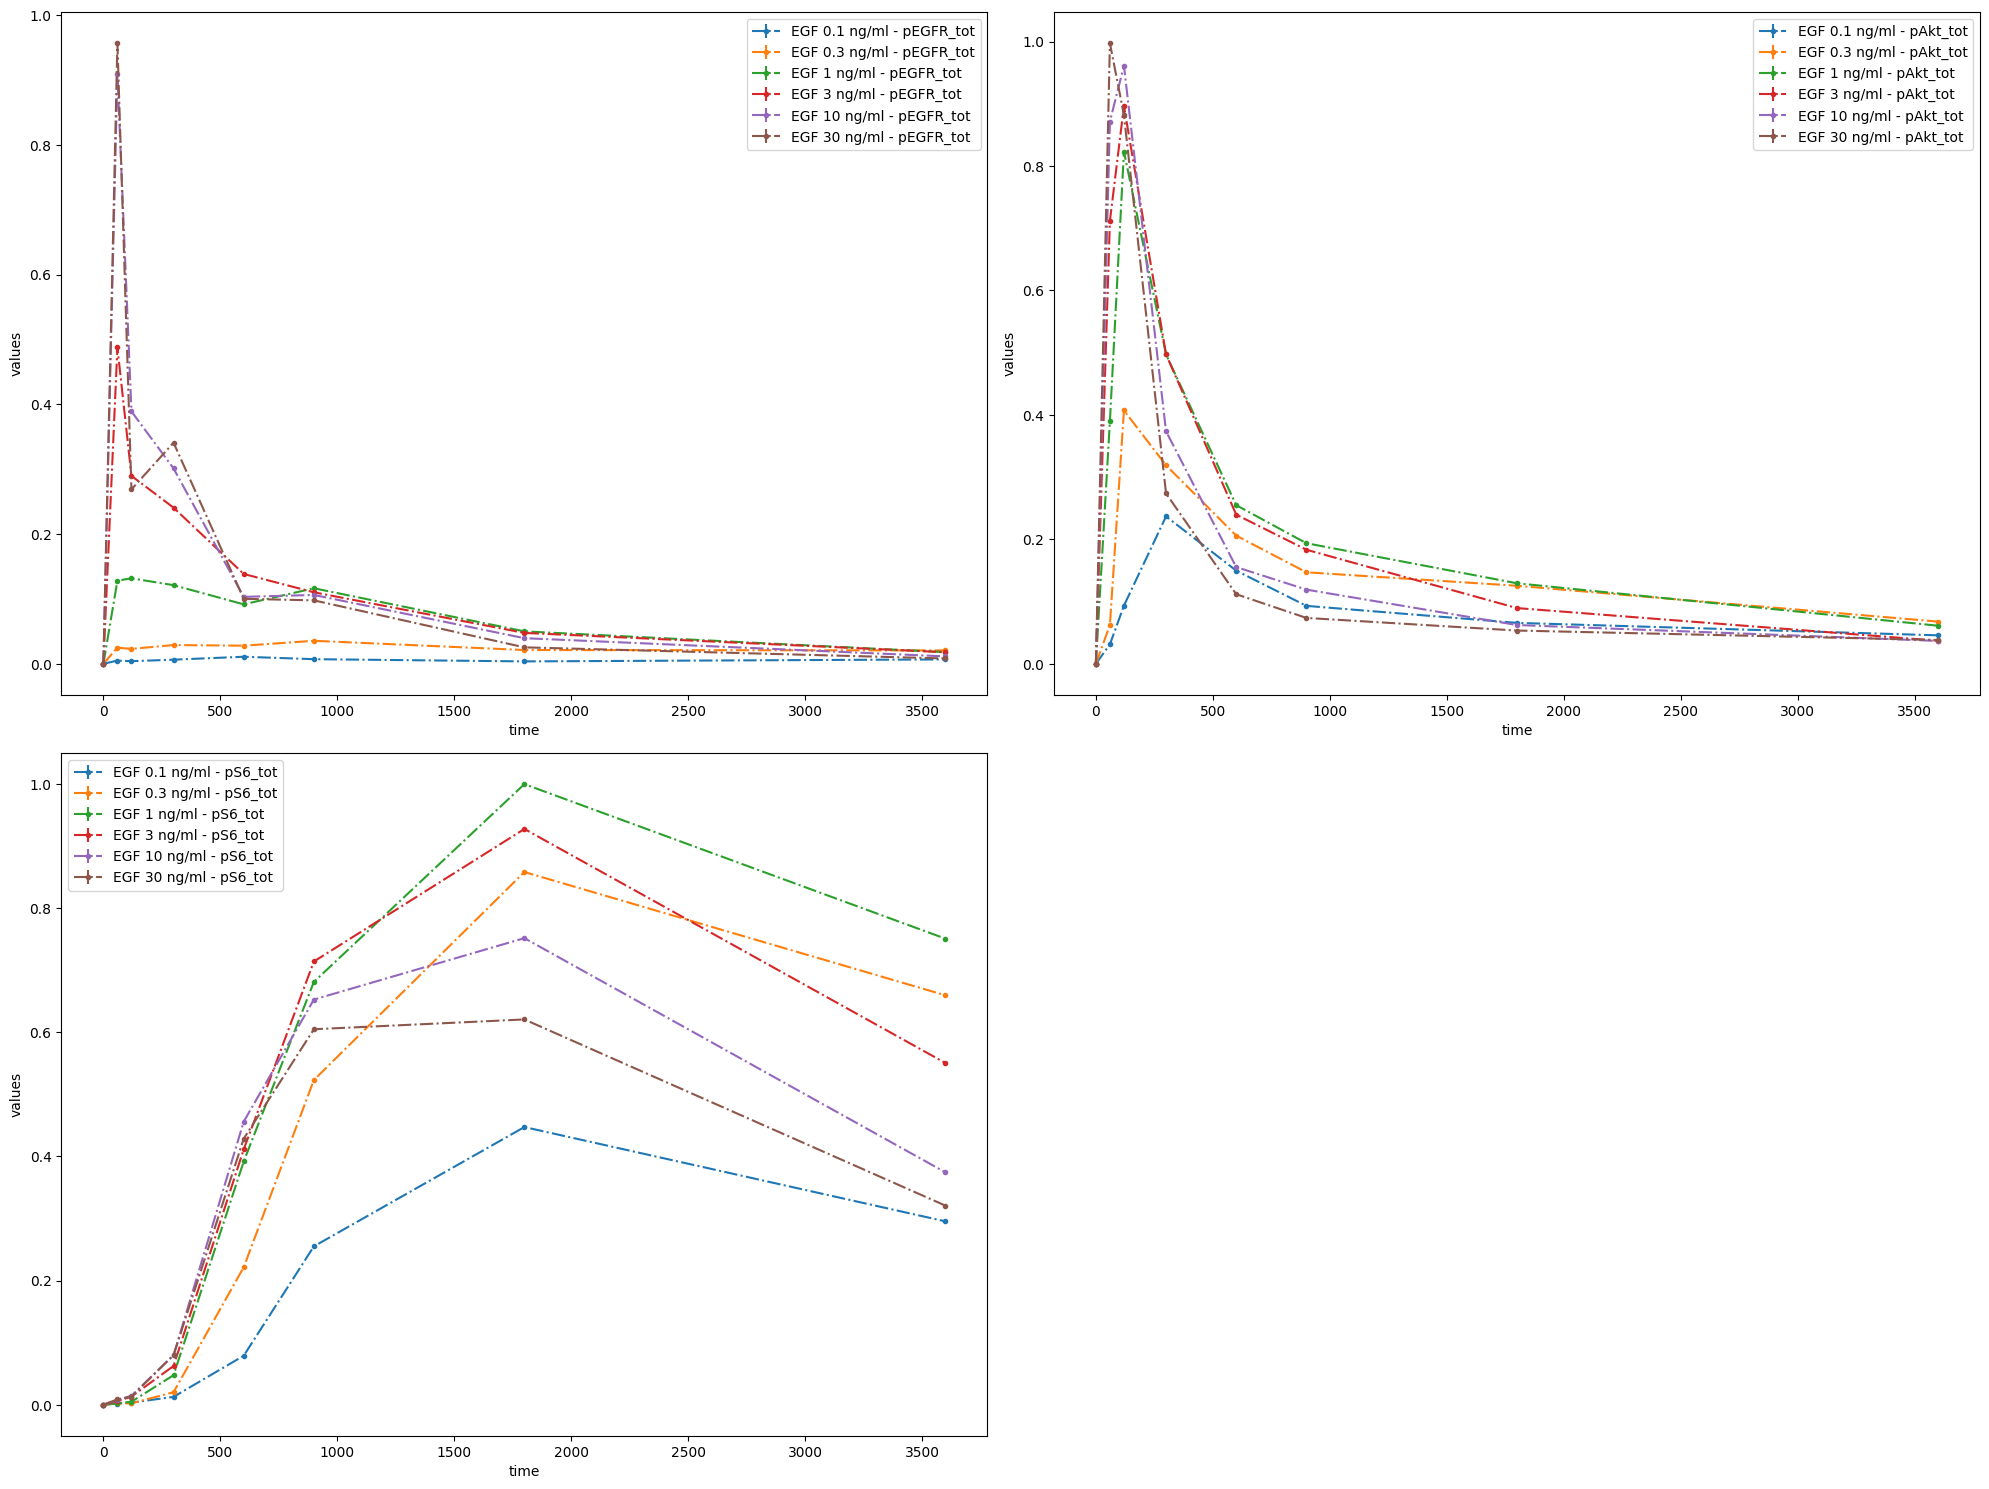
As nothing was specified regarding what should be plotted, the defaults were used. Namely, it was assumed that measurements are time series data, and they were grouped by observables.
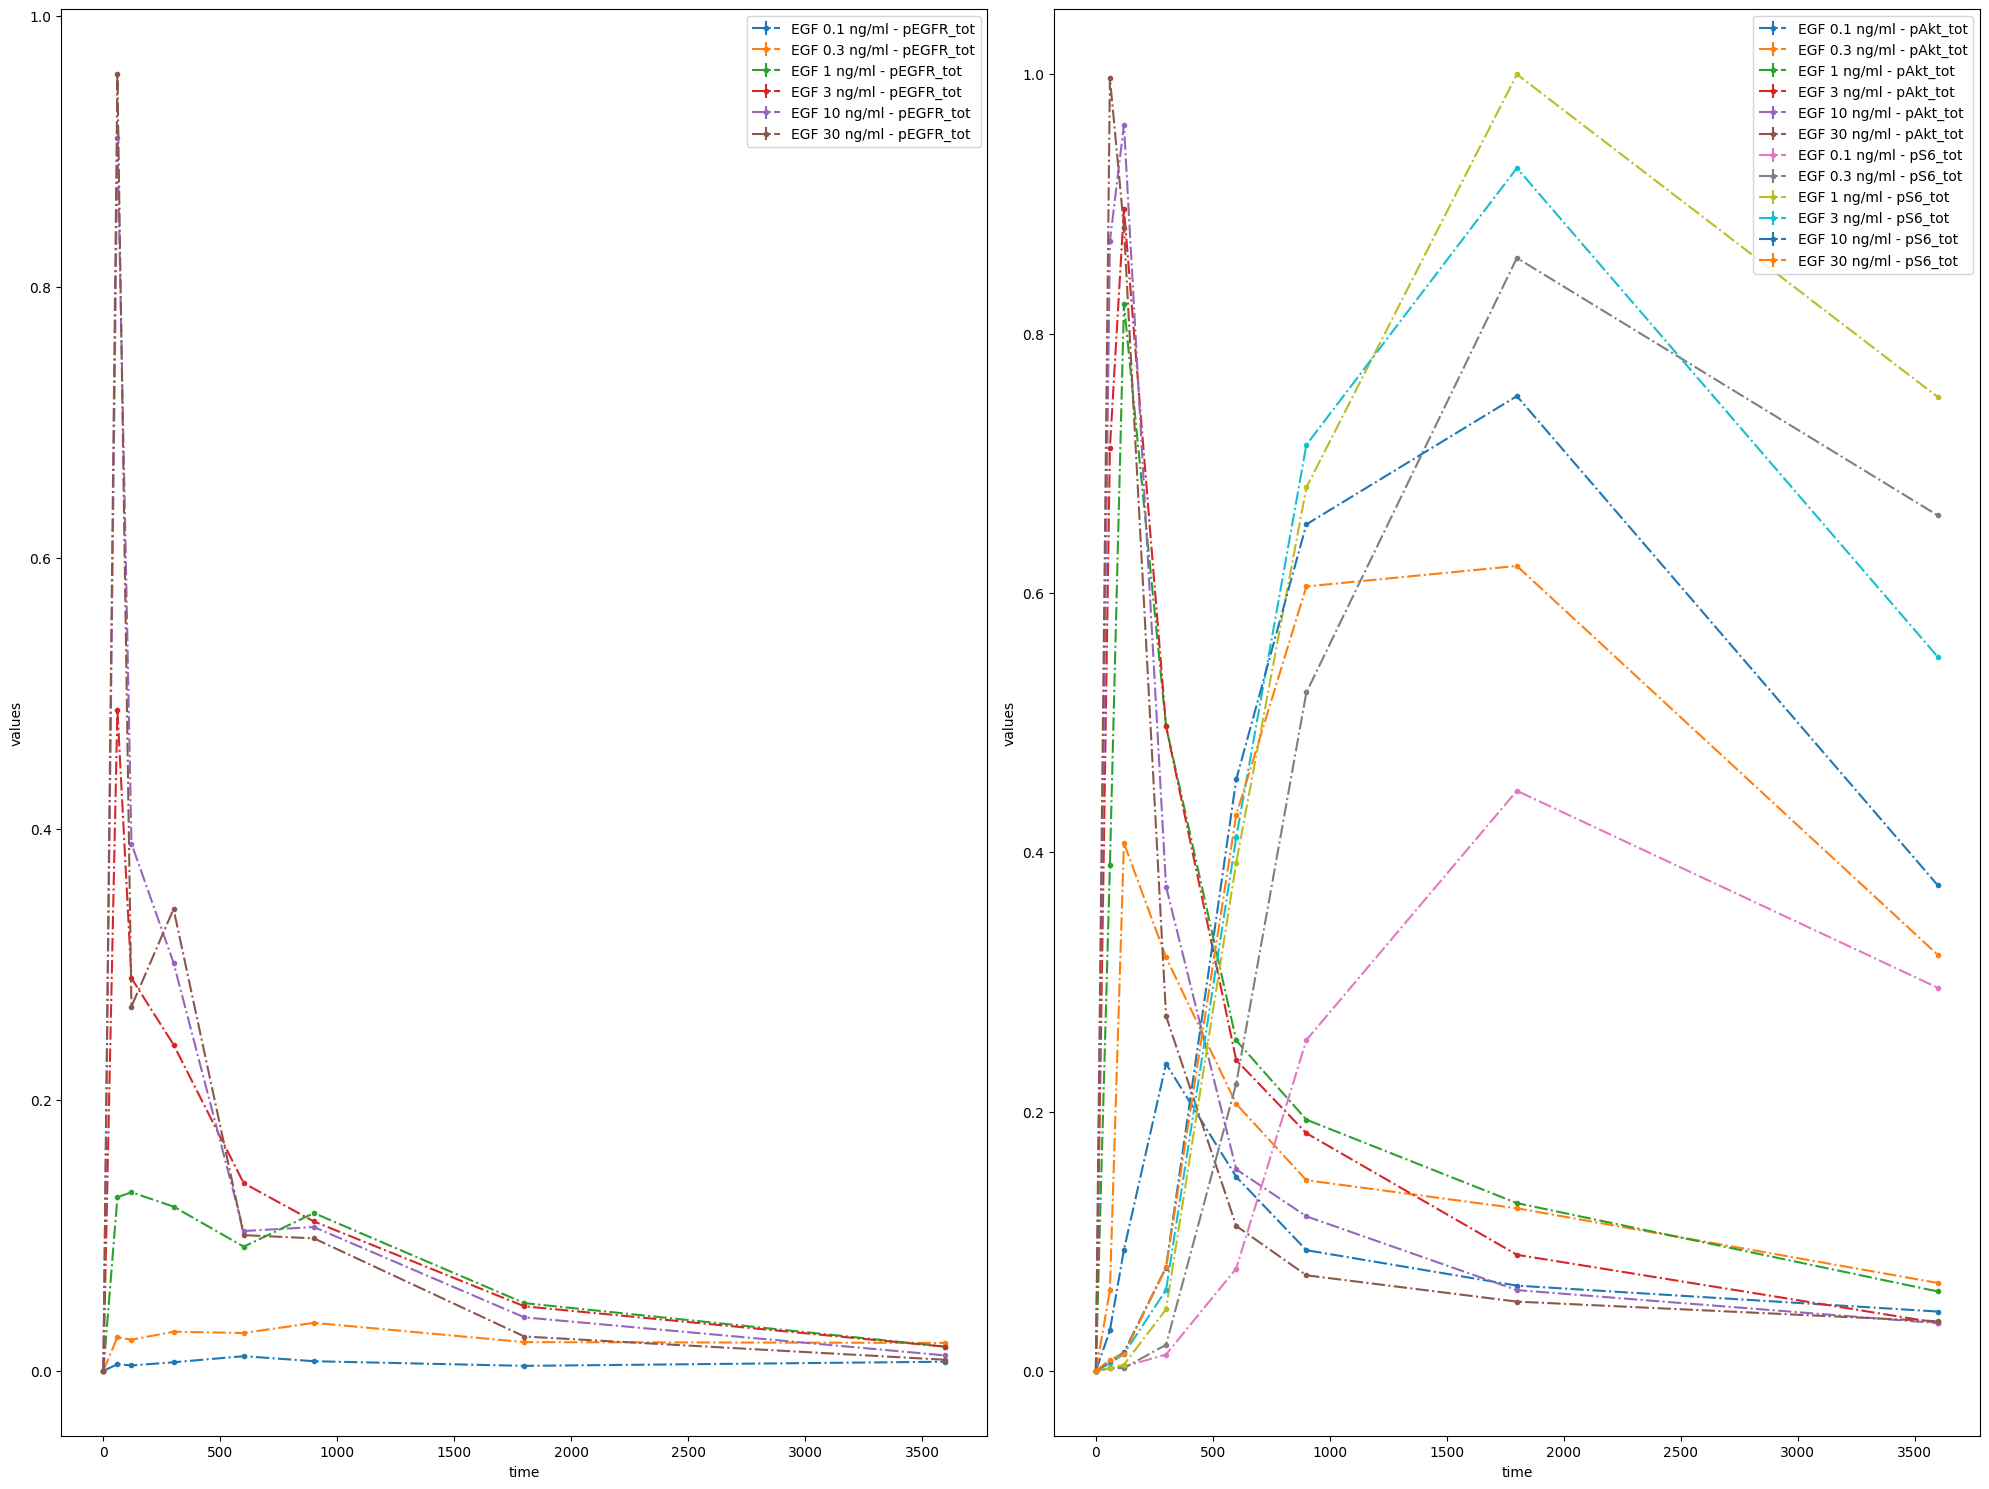
You can specify how many subplot there should be and what should be plotted on each of them. It can easily be done by providing grouping_list, which by default specifies, which observables should be plotted on a paricular plot. The value of grouping_list should be a list of lists, each sublist corresponds to a separate plot.
ax = petab.visualize.plot_problem(
    petab_problem=pp, grouping_list=[["pEGFR_tot"], ["pAkt_tot", "pS6_tot"]]
)
Another option is to specify which simulation conditions should be plotted.
ax = petab.visualize.plot_problem(
    petab_problem=pp,
    grouping_list=[
        ["model1_data1"],
        ["model1_data2", "model1_data3"],
        ["model1_data4", "model1_data5", "model1_data6"],
    ],
    group_by="simulation",
)
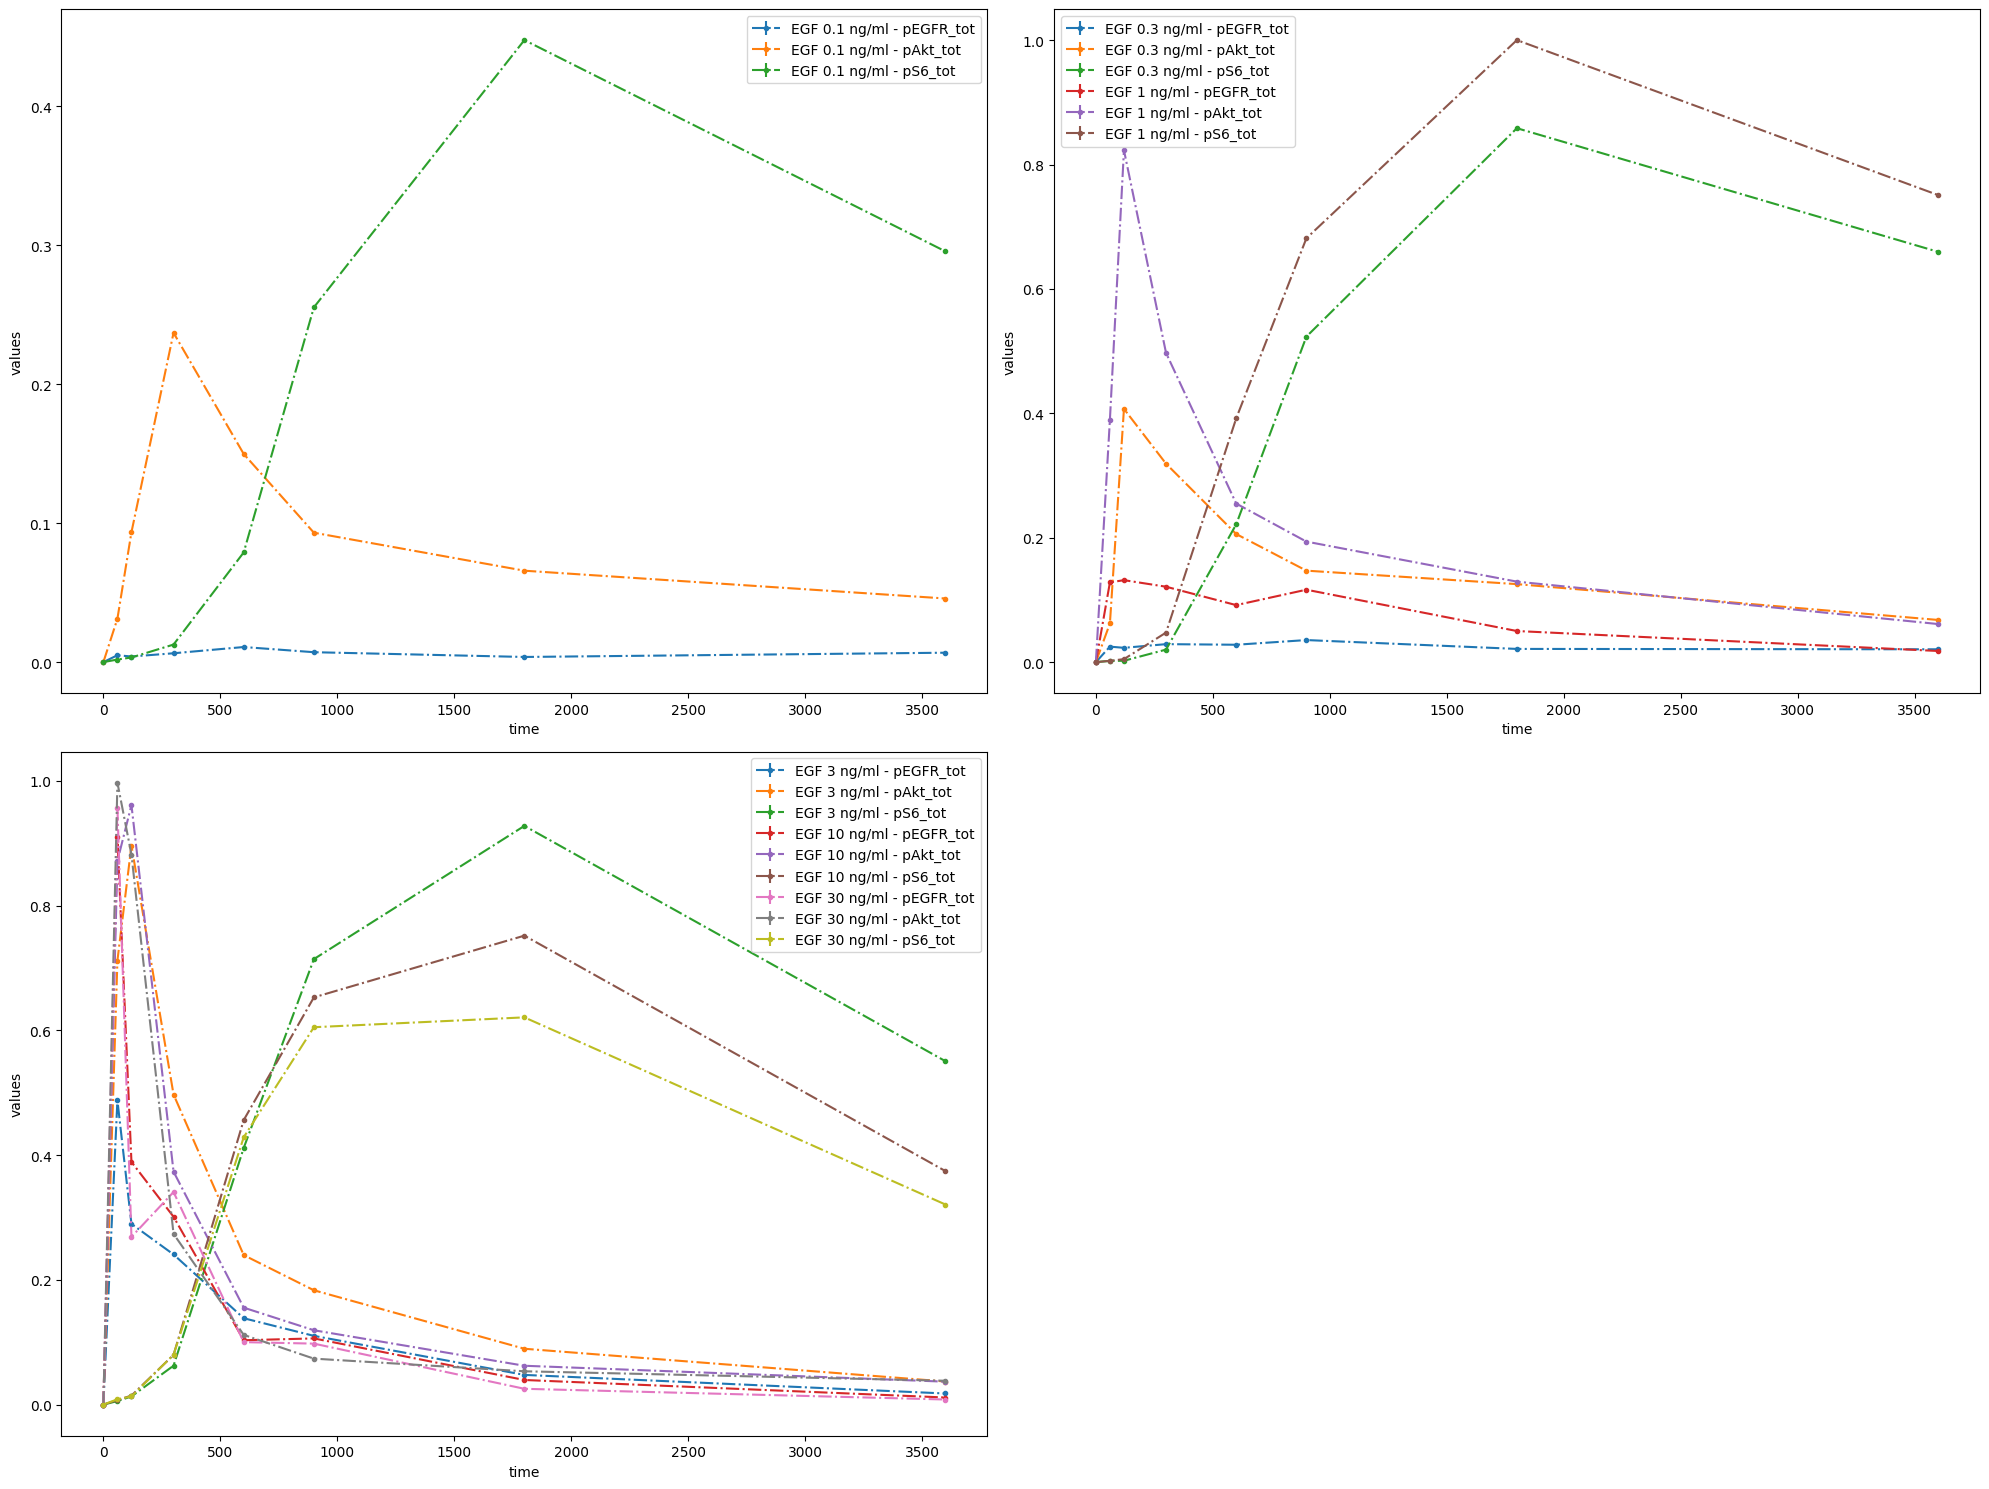
Finally, measurements can be grouped by datasetIds.
ax = petab.visualize.plot_problem(
    petab_problem=pp,
    grouping_list=[
        [
            "model1_data1_pEGFR_tot",
            "model1_data2_pEGFR_tot",
            "model1_data3_pEGFR_tot",
            "model1_data4_pEGFR_tot",
            "model1_data5_pEGFR_tot",
            "model1_data6_pEGFR_tot",
        ],
        [
            "model1_data1_pAkt_tot",
            "model1_data2_pAkt_tot",
            "model1_data3_pAkt_tot",
            "model1_data4_pAkt_tot",
            "model1_data5_pAkt_tot",
            "model1_data6_pAkt_tot",
        ],
        [
            "model1_data1_pS6_tot",
            "model1_data2_pS6_tot",
            "model1_data3_pS6_tot",
            "model1_data4_pS6_tot",
            "model1_data5_pS6_tot",
            "model1_data6_pS6_tot",
        ],
    ],
    group_by="dataset",
)
To summarize, measurements can be grouped by observables, simulation conditions and datasets with the plot_problem() function. This can be specified by setting the value of group_by parameter to 'observable' (default), 'simulation' or 'dataset' and by providing corresponding ids in grouping_list, which is a list of lists. Each sublist specifies a separate plot and its elements are either simulation condition IDs or observable IDs or the dataset IDs.