Visualization with visualization specification file
As described in the documentation, visualization specification file (VS) is a tab-separated value file containing the specification of the visualization routines which come with the PEtab repository. In this example, we will discuss how to specify different visualization settings by means of the VS.
Let’s plot measurements corresponding to the ones of the models from the Benchmark collection Fujita_SciSignal2010.
[1]:
import petab
from petab.visualize import plot_data_and_simulation

folder = "example_Fujita/"
data_file_path = folder + "Fujita_measurementData.tsv"
condition_file_path = folder + "Fujita_experimentalCondition.tsv"
observables_file_path = folder + "Fujita_observables.tsv"
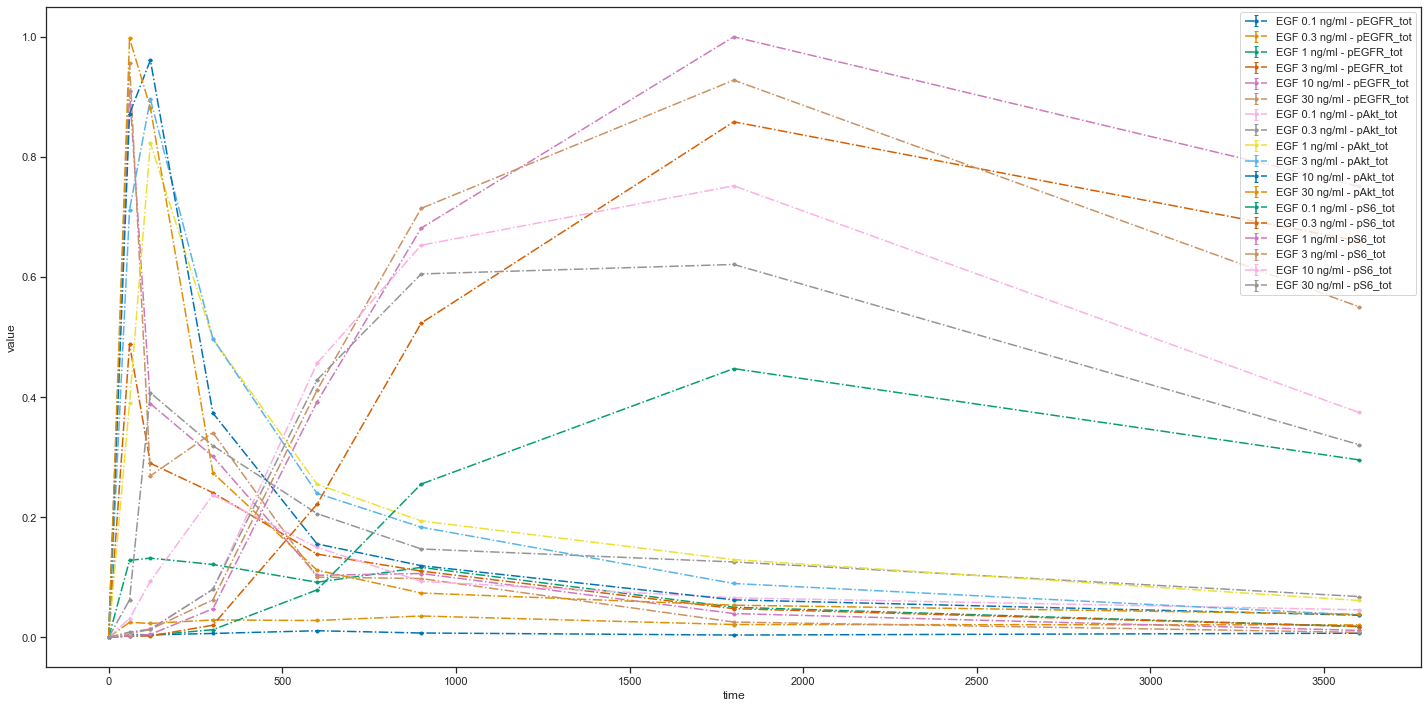
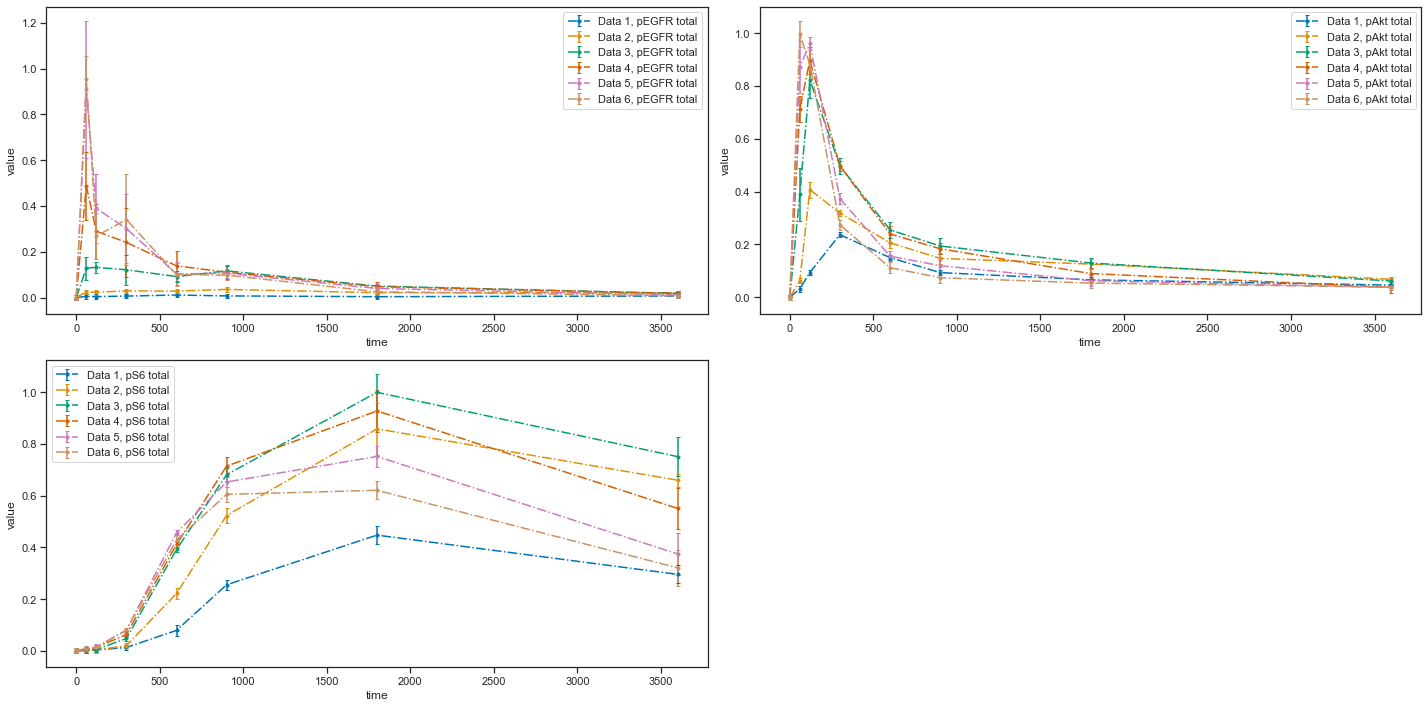
If no settings are provided, the measurements will be plotted with default settings. Namely, it will be assumed that the independent variable is time and all datasets will appear on one plot. Example of such behaviour you can see on the first plot here. This also applies to the case when VS is empty:
[2]:
visualization_file_path = folder + "/visuSpecs/Fujita_visuSpec_empty.tsv"

pp = petab.Problem.from_files(measurement_file=data_file_path,
                              condition_file=condition_file_path,
                              observable_files=observables_file_path,
                              visualization_files=visualization_file_path)
ax = petab.visualize.plot_petab_problem(petab_problem=pp)
/home/polina/Documents/Development/PEtab/petab/visualize/helper_functions.py:147: UserWarning: Default plotting: grouping by observable. If you want to specify another grouping option, please add 'datasetId' columns.
  warnings.warn('Default plotting: grouping by observable. If you want '
/home/polina/Documents/Development/PEtab/petab/visualize/helper_functions.py:158: UserWarning: DatasetIds would have been available, but other grouping was requested. Consider using datasetId.
  warnings.warn("DatasetIds would have been available, but other "
First of all, let us create a visualization specification file with only mandatory columns. In fact, there is only one mandatory column: plotId. Resulting plot using the VS
plotId |
|---|
plot1 |
is the same as before:
[3]:
visualization_file_path = folder + "/visuSpecs/Fujita_visuSpec_mandatory.tsv"

pp = petab.Problem.from_files(measurement_file=data_file_path,
                              condition_file=condition_file_path,
                              observable_files=observables_file_path,
                              visualization_files=visualization_file_path)

ax = petab.visualize.plot_petab_problem(petab_problem=pp)

Now let’s try adding some settings:
plotId |
xOffset |
yScale |
|---|---|---|
plot1 |
100 |
log |
[4]:
visualization_file_path = folder + "/visuSpecs/Fujita_visuSpec_1.tsv"

pp = petab.Problem.from_files(measurement_file=data_file_path,
                              condition_file=condition_file_path,
                              observable_files=observables_file_path,
                              visualization_files=visualization_file_path)

ax = petab.visualize.plot_petab_problem(petab_problem=pp)
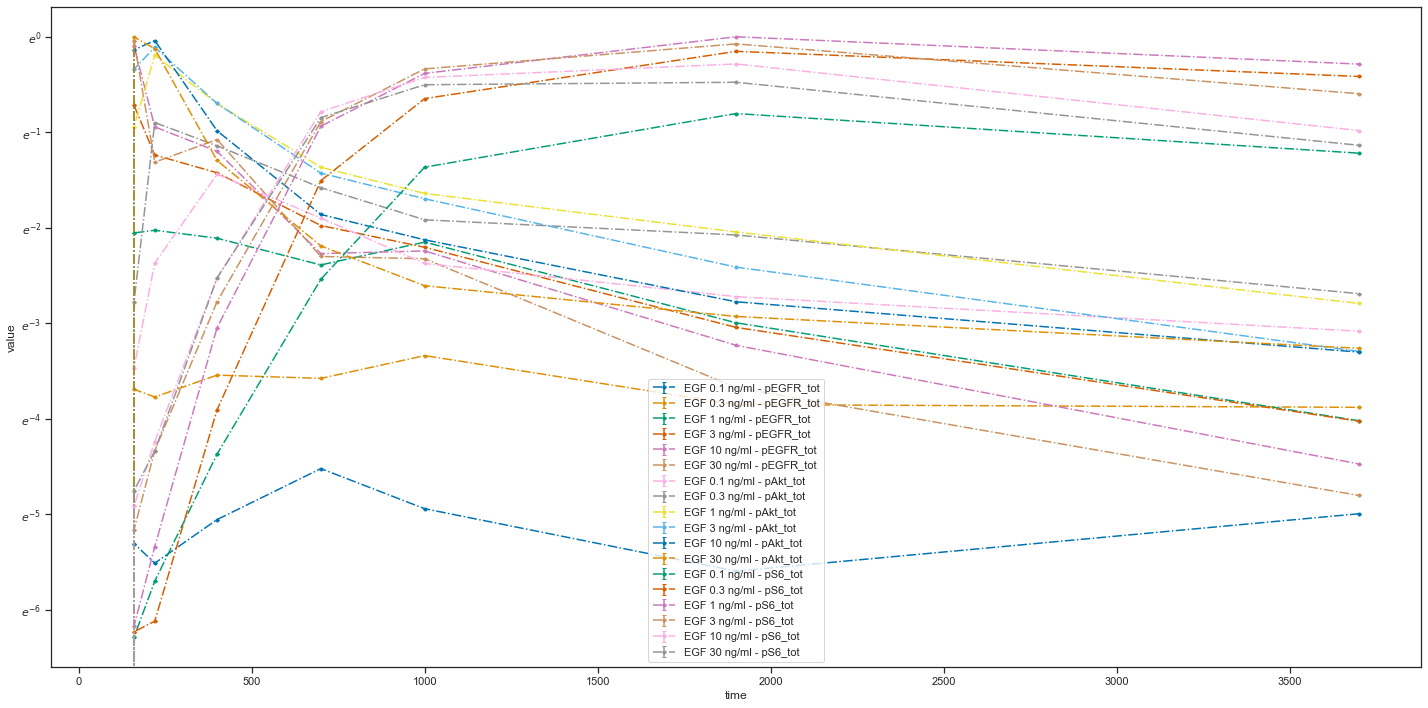
As you can see, the scale of the y-axis changed to a logarithmic one and an offset for the independent variable is set to 100.
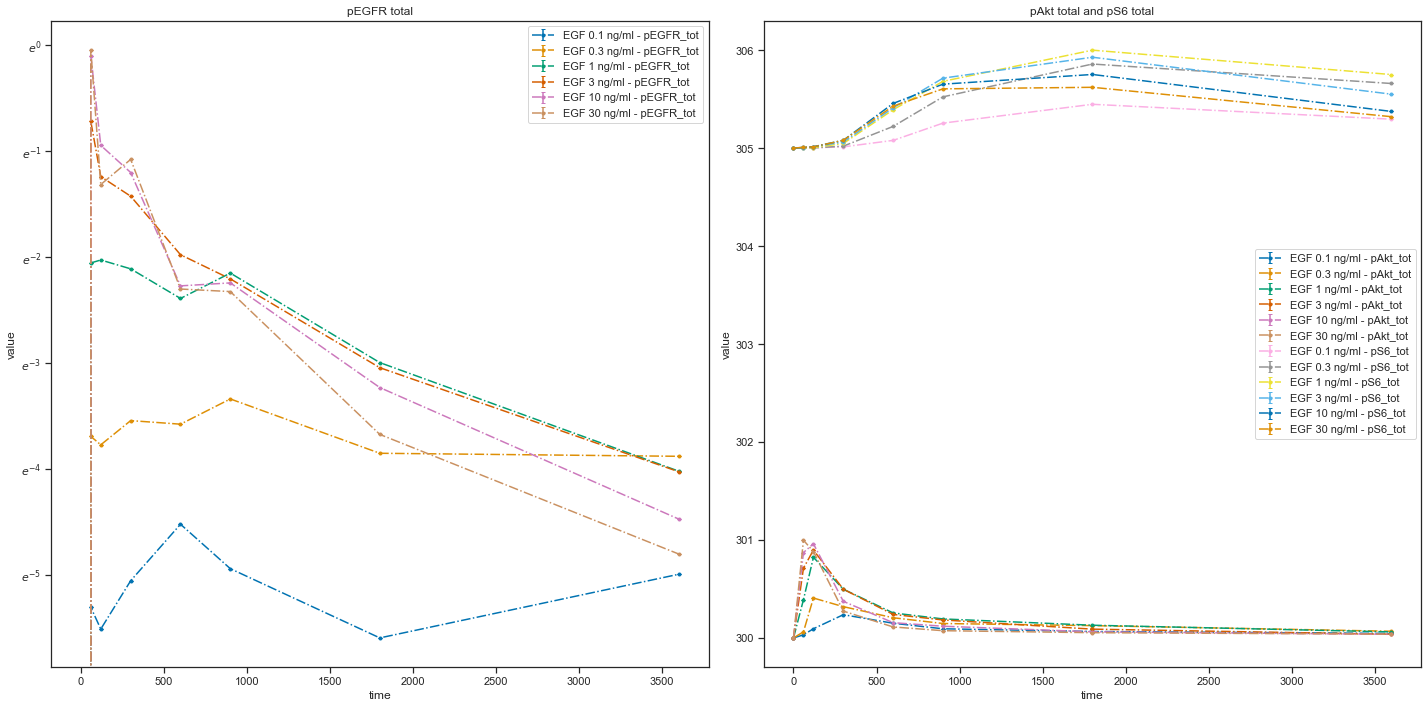
You can group measurements by observables by adding yValues column:
plotId |
yValues |
yOffset |
yScale |
plotName |
|---|---|---|---|---|
plot1 |
pEGFR_tot |
0 |
log |
pEGFR total |
plot2 |
pAkt_tot |
300 |
lin |
pAkt total and pS6 total |
plot2 |
pS6_tot |
305 |
lin |
pAkt total and pS6 total |
[5]:
visualization_file_path = folder + "/visuSpecs/Fujita_visuSpec_2.tsv"

pp = petab.Problem.from_files(measurement_file=data_file_path,
                              condition_file=condition_file_path,
                              observable_files=observables_file_path,
                              visualization_files=visualization_file_path)

ax = petab.visualize.plot_petab_problem(petab_problem=pp)
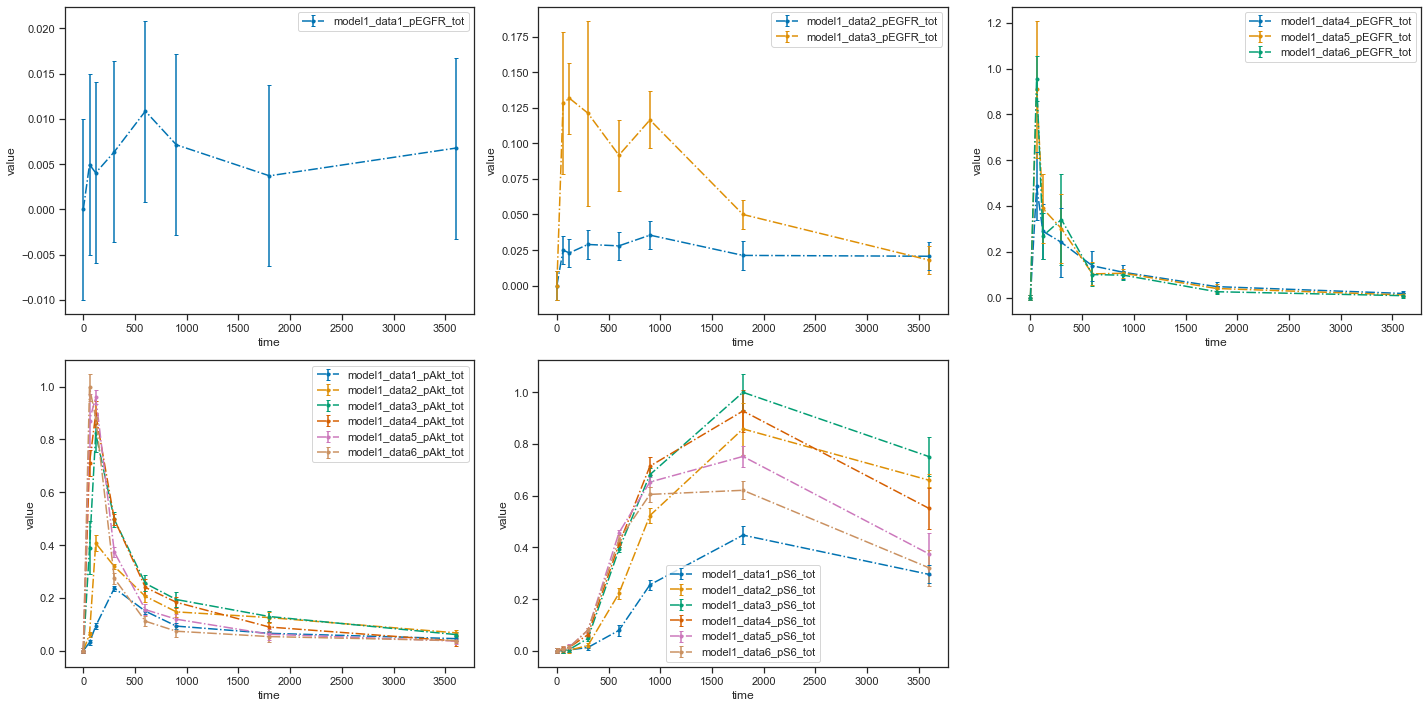
You can also plot individual datasets:
plotId |
plotTypeSimulation |
plotTypeData |
datasetId |
xValues |
|---|---|---|---|---|
plot1 |
LinePlot |
provided |
model1_data1_pEGFR_tot |
time |
plot2 |
LinePlot |
provided |
model1_data2_pEGFR_tot |
time |
plot2 |
LinePlot |
provided |
model1_data3_pEGFR_tot |
time |
plot3 |
LinePlot |
provided |
model1_data4_pEGFR_tot |
time |
plot3 |
LinePlot |
provided |
model1_data5_pEGFR_tot |
time |
plot3 |
LinePlot |
provided |
model1_data6_pEGFR_tot |
time |
[6]:
visualization_file_path = folder + "/visuSpecs/Fujita_visuSpec_individual_datasets.tsv"

pp = petab.Problem.from_files(measurement_file=data_file_path,
                              condition_file=condition_file_path,
                              observable_files=observables_file_path,
                              visualization_files=visualization_file_path)

ax = petab.visualize.plot_petab_problem(petab_problem=pp)
[7]:
visualization_file_path = folder + "/visuSpecs/Fujita_visuSpec_datasetIds.tsv"

pp = petab.Problem.from_files(measurement_file=data_file_path,
                              condition_file=condition_file_path,
                              observable_files=observables_file_path,
                              visualization_files=visualization_file_path)

ax = petab.visualize.plot_petab_problem(petab_problem=pp)
As you can see, with the VS file you have an opportunity to plot each dataset individually or groups of datasets. Refer to the documentation for descriptions of all possible settings. If you have any questions or encounter some problems, please create an issue. We will be happy to help!
[ ]: